> ## Documentation Index
> Fetch the complete documentation index at: https://docs.apigene.ai/llms.txt
> Use this file to discover all available pages before exploring further.
# Dashboard
> Monitor usage, performance, and insights across your applications
## Overview
The Dashboard provides a comprehensive view of your Apigene Copilot usage. It visualizes API calls, performance metrics, and user activity, helping you understand how your team uses applications and identify optimization opportunities.
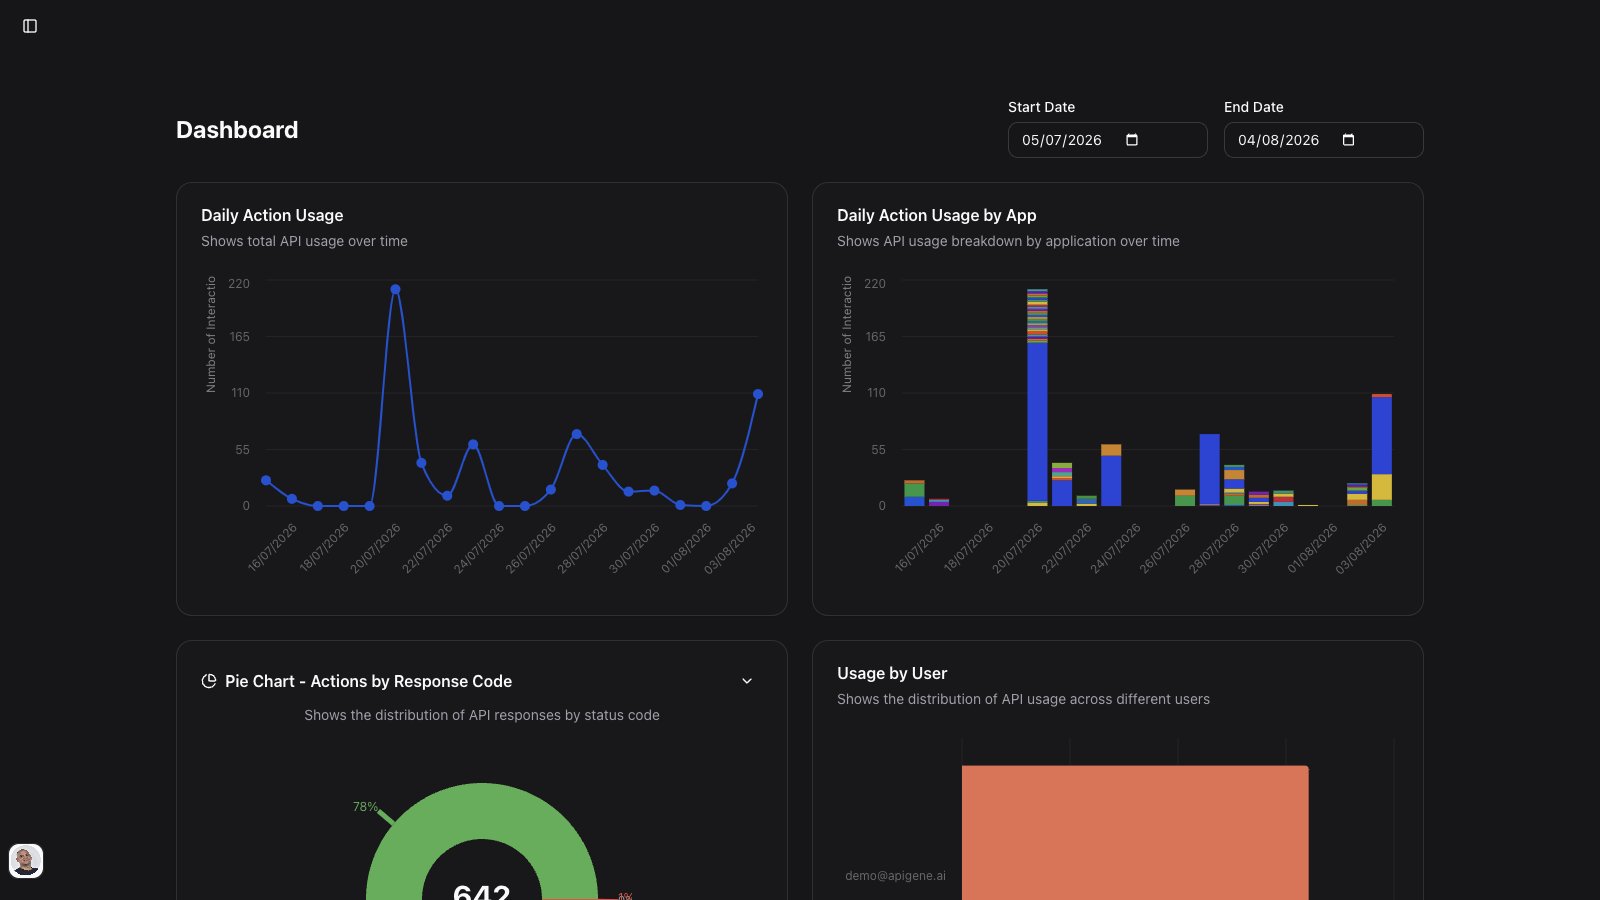 ## Accessing the Dashboard
Navigate to **Dashboard** from the main navigation menu to view your analytics.
## Dashboard Features
### Date Range Selection
Control the time period for your analytics:
**Date Pickers**
* **Start Date**: Beginning of the analysis period
* **End Date**: End of the analysis period
* **Default**: Last 30 days
**Usage**
1. Click on the start date field
2. Select your desired start date
3. Click on the end date field
4. Select your desired end date
5. Dashboard updates automatically
**Tips**
* Use shorter ranges for detailed analysis
* Use longer ranges for trend identification
* Common ranges: 7 days, 30 days, 90 days, 1 year
## Analytics Charts
### Daily Action Usage (Total)
**What It Shows**
* Total number of API calls per day
* Overall activity trends
* Usage patterns over time
**Chart Features**
* Line graph visualization
* Hover to see exact counts
* Color-coded for clarity
* Automatic scaling
**Insights**
* **Rising trend**: Increased adoption or usage
* **Declining trend**: Reduced activity or issues
* **Spikes**: One-time events or campaigns
* **Flat line**: Consistent daily usage
**Use Cases**
* Monitor overall platform adoption
* Identify peak usage times
* Detect unusual activity
* Plan capacity and resources
### Daily Action Usage (By Application)
**What It Shows**
* API calls broken down by application
* Which applications are most used
* Application usage trends
**Chart Features**
* Stacked area or grouped bars
* Different color per application
* Legend for application identification
* Interactive hover details
**Insights**
* **Dominant applications**: Most critical integrations
* **Growing usage**: Successful integrations
* **Declining usage**: Issues or reduced need
* **Unused applications**: Consider removing
**Use Cases**
* Prioritize application maintenance
* Allocate resources to popular integrations
* Identify training opportunities
* Optimize application configurations
### Actions by Response Code
**What It Shows**
* Distribution of HTTP status codes
* Success rate of API calls
* Error patterns and frequency
**Chart Features**
* Pie chart or bar chart
* Color-coded by status type
* **Green**: Success (2xx)
* **Yellow**: Client errors (4xx)
* **Red**: Server errors (5xx)
* Percentage and count displayed
**Insights**
* **High success rate (>95%)**: Healthy integrations
* **Client errors (4xx)**: Configuration or usage issues
* **Server errors (5xx)**: API provider issues
* **401/403 errors**: Authentication problems
**Use Cases**
* Monitor integration health
* Identify authentication issues
* Detect API provider problems
* Track improvement over time
### Usage by User
**What It Shows**
* API call distribution across users
* Top users by activity
* Usage patterns per user
**Chart Features**
* Bar chart or table
* Sorted by usage (highest first)
* User ID displayed
* Action count per user
**Insights**
* **Power users**: Heavy platform users, potential champions
* **Light users**: May need training or support
* **Inactive users**: Follow up or remove access
* **Balanced distribution**: Healthy team adoption
**Use Cases**
* Identify platform champions
* Provide targeted training
* Allocate user licenses
* Recognize active contributors
## Empty State
When no data is available for the selected period:
**What You'll See**
* Friendly empty state message
* Icon indicating no data
* Quick tips to generate data
**Message Example**
```
Welcome to your Dashboard 👋
We didn't find any usage data for your selected time period.
Configure your apps and start making actions to see
comprehensive analytics and insights here.
```
**Getting Started Steps**
1. Configure your apps in the Applications section
2. Start making actions in Copilot
3. View your usage analytics in Dashboard
## Interpreting Your Data
### Success Metrics
**Healthy Integration Indicators**
* Success rate above 95%
* Consistent daily usage
* Low error rates
* Fast response times
**Warning Signs**
* Success rate below 90%
* High client error rates (4xx)
* Frequent authentication failures
* Increasing error trends
### Usage Patterns
**Normal Patterns**
* Weekday activity, weekend quiet
* Aligned with business hours
* Consistent per-user usage
* Predictable application mix
**Unusual Patterns**
* Weekend/night spikes (investigate)
* Sudden usage drops (issues?)
* Single-user domination (over-reliance)
* Application abandonment (why?)
### Performance Indicators
**Good Performance**
* Most responses under 1 second
* Consistent response times
* Low timeout rates
* High cache hit rates
**Performance Issues**
* Increasing response times
* Frequent timeouts
* Low cache effectiveness
* High server error rates
## Taking Action Based on Insights
### High Error Rates
**Steps to Take**
1. Navigate to Actions page
2. Filter by error status codes
3. Review failed requests
4. Common fixes:
* Update expired credentials
* Fix parameter formats
* Adjust rate limiting
* Contact API provider for 5xx errors
### Low Usage
**Possible Reasons**
* Users don't know about features
* Integration not meeting needs
* Complex setup or usage
* Better alternatives available
**Actions**
1. Survey users for feedback
2. Provide training or documentation
3. Simplify configuration
4. Consider deprecating unused integrations
### High Usage on Specific Apps
**Optimization Opportunities**
* Create dedicated agents for common tasks
* Add context items for frequently accessed data
* Implement caching strategies
* Consider API upgrade for more capacity
**Best Practices**
* Monitor rate limits
* Optimize parameter usage
* Batch operations when possible
* Use webhooks for real-time updates
### Uneven User Distribution
**If Few Power Users**
* Document their use cases
* Create templates from their workflows
* Share best practices with team
* Build agents based on their patterns
**If Many Light Users**
* Provide onboarding training
* Share example use cases
* Offer office hours or support
* Simplify common workflows
## Dashboard Best Practices
### Regular Review Cadence
**Daily**
* Quick check for major errors
* Verify critical integrations working
* Monitor unusual spikes or drops
**Weekly**
* Detailed error analysis
* User activity review
* Application performance check
* Identify optimization opportunities
**Monthly**
* Trend analysis over time
* Calculate success metrics
* Review ROI of integrations
* Plan improvements or additions
### Combining with Other Features
**Dashboard + Actions**
1. See error spike in Dashboard
2. Navigate to Actions
3. Filter by error codes
4. Identify and fix root cause
**Dashboard + Audit Logs**
1. Notice usage change
2. Check Audit Logs for changes
3. Correlate configuration updates
4. Adjust as needed
**Dashboard + Settings**
1. Identify slow applications
2. Review application settings
3. Optimize configurations
4. Monitor improvement
### Setting Goals
**Usage Goals**
* Target daily action count
* Desired user adoption rate
* Application coverage percentage
* Success rate threshold (e.g., >95%)
**Performance Goals**
* Average response time targets
* Cache hit rate goals
* Error rate limits
* User satisfaction scores
## Exporting Data
### Use Cases for Export
* External reporting tools
* Executive presentations
* Long-term trend analysis
* Integration with other systems
### Export Options
* Download as CSV or JSON
* Include selected date range
* Filter before export
* Schedule regular exports (if available)
## Troubleshooting
### Dashboard Shows No Data
**Possible Causes**
* Date range has no activity
* Filters excluding all data
* No actions executed yet
* Loading in progress
**Solutions**
1. Expand date range
2. Clear any filters
3. Execute actions in Copilot
4. Refresh the page
5. Wait for data to load
### Charts Not Loading
**Possible Causes**
* Network connectivity issues
* Browser compatibility
* Large dataset timeout
* JavaScript errors
**Solutions**
1. Check internet connection
2. Try different browser
3. Reduce date range
4. Clear browser cache
5. Contact support if persists
### Unexpected Data
**Possible Causes**
* Timezone differences
* Test or automated actions included
* Multiple users sharing account
* Cached data not refreshed
**Solutions**
1. Verify timezone settings
2. Filter by specific users
3. Check for automated workflows
4. Refresh dashboard
5. Verify date range selection
## Privacy and Security
### Data Displayed
* Aggregated usage metrics
* User activity summaries
* Application statistics
* Performance metrics
### Data Not Shown
* Sensitive API data
* Authentication credentials
* Personal information
* Raw request/response bodies
### Access Control
* Role-based access
* Organization-level visibility
* User privacy respected
* Audit trail of dashboard access
## Mobile Access
The Dashboard is optimized for mobile viewing:
* Responsive charts
* Touch-friendly controls
* Swipe navigation
* Essential metrics prioritized
## Next Steps
* [Review specific actions](/user-guide/actions) for detailed debugging
* [Open Insights](/user-guide/insights) for per-agent performance analytics
* [Configure applications](/user-guide/applications) to improve success rates
* [Create agents](/user-guide/agents) for common workflows
* [Check audit logs](/user-guide/audit) for configuration changes
## Accessing the Dashboard
Navigate to **Dashboard** from the main navigation menu to view your analytics.
## Dashboard Features
### Date Range Selection
Control the time period for your analytics:
**Date Pickers**
* **Start Date**: Beginning of the analysis period
* **End Date**: End of the analysis period
* **Default**: Last 30 days
**Usage**
1. Click on the start date field
2. Select your desired start date
3. Click on the end date field
4. Select your desired end date
5. Dashboard updates automatically
**Tips**
* Use shorter ranges for detailed analysis
* Use longer ranges for trend identification
* Common ranges: 7 days, 30 days, 90 days, 1 year
## Analytics Charts
### Daily Action Usage (Total)
**What It Shows**
* Total number of API calls per day
* Overall activity trends
* Usage patterns over time
**Chart Features**
* Line graph visualization
* Hover to see exact counts
* Color-coded for clarity
* Automatic scaling
**Insights**
* **Rising trend**: Increased adoption or usage
* **Declining trend**: Reduced activity or issues
* **Spikes**: One-time events or campaigns
* **Flat line**: Consistent daily usage
**Use Cases**
* Monitor overall platform adoption
* Identify peak usage times
* Detect unusual activity
* Plan capacity and resources
### Daily Action Usage (By Application)
**What It Shows**
* API calls broken down by application
* Which applications are most used
* Application usage trends
**Chart Features**
* Stacked area or grouped bars
* Different color per application
* Legend for application identification
* Interactive hover details
**Insights**
* **Dominant applications**: Most critical integrations
* **Growing usage**: Successful integrations
* **Declining usage**: Issues or reduced need
* **Unused applications**: Consider removing
**Use Cases**
* Prioritize application maintenance
* Allocate resources to popular integrations
* Identify training opportunities
* Optimize application configurations
### Actions by Response Code
**What It Shows**
* Distribution of HTTP status codes
* Success rate of API calls
* Error patterns and frequency
**Chart Features**
* Pie chart or bar chart
* Color-coded by status type
* **Green**: Success (2xx)
* **Yellow**: Client errors (4xx)
* **Red**: Server errors (5xx)
* Percentage and count displayed
**Insights**
* **High success rate (>95%)**: Healthy integrations
* **Client errors (4xx)**: Configuration or usage issues
* **Server errors (5xx)**: API provider issues
* **401/403 errors**: Authentication problems
**Use Cases**
* Monitor integration health
* Identify authentication issues
* Detect API provider problems
* Track improvement over time
### Usage by User
**What It Shows**
* API call distribution across users
* Top users by activity
* Usage patterns per user
**Chart Features**
* Bar chart or table
* Sorted by usage (highest first)
* User ID displayed
* Action count per user
**Insights**
* **Power users**: Heavy platform users, potential champions
* **Light users**: May need training or support
* **Inactive users**: Follow up or remove access
* **Balanced distribution**: Healthy team adoption
**Use Cases**
* Identify platform champions
* Provide targeted training
* Allocate user licenses
* Recognize active contributors
## Empty State
When no data is available for the selected period:
**What You'll See**
* Friendly empty state message
* Icon indicating no data
* Quick tips to generate data
**Message Example**
```
Welcome to your Dashboard 👋
We didn't find any usage data for your selected time period.
Configure your apps and start making actions to see
comprehensive analytics and insights here.
```
**Getting Started Steps**
1. Configure your apps in the Applications section
2. Start making actions in Copilot
3. View your usage analytics in Dashboard
## Interpreting Your Data
### Success Metrics
**Healthy Integration Indicators**
* Success rate above 95%
* Consistent daily usage
* Low error rates
* Fast response times
**Warning Signs**
* Success rate below 90%
* High client error rates (4xx)
* Frequent authentication failures
* Increasing error trends
### Usage Patterns
**Normal Patterns**
* Weekday activity, weekend quiet
* Aligned with business hours
* Consistent per-user usage
* Predictable application mix
**Unusual Patterns**
* Weekend/night spikes (investigate)
* Sudden usage drops (issues?)
* Single-user domination (over-reliance)
* Application abandonment (why?)
### Performance Indicators
**Good Performance**
* Most responses under 1 second
* Consistent response times
* Low timeout rates
* High cache hit rates
**Performance Issues**
* Increasing response times
* Frequent timeouts
* Low cache effectiveness
* High server error rates
## Taking Action Based on Insights
### High Error Rates
**Steps to Take**
1. Navigate to Actions page
2. Filter by error status codes
3. Review failed requests
4. Common fixes:
* Update expired credentials
* Fix parameter formats
* Adjust rate limiting
* Contact API provider for 5xx errors
### Low Usage
**Possible Reasons**
* Users don't know about features
* Integration not meeting needs
* Complex setup or usage
* Better alternatives available
**Actions**
1. Survey users for feedback
2. Provide training or documentation
3. Simplify configuration
4. Consider deprecating unused integrations
### High Usage on Specific Apps
**Optimization Opportunities**
* Create dedicated agents for common tasks
* Add context items for frequently accessed data
* Implement caching strategies
* Consider API upgrade for more capacity
**Best Practices**
* Monitor rate limits
* Optimize parameter usage
* Batch operations when possible
* Use webhooks for real-time updates
### Uneven User Distribution
**If Few Power Users**
* Document their use cases
* Create templates from their workflows
* Share best practices with team
* Build agents based on their patterns
**If Many Light Users**
* Provide onboarding training
* Share example use cases
* Offer office hours or support
* Simplify common workflows
## Dashboard Best Practices
### Regular Review Cadence
**Daily**
* Quick check for major errors
* Verify critical integrations working
* Monitor unusual spikes or drops
**Weekly**
* Detailed error analysis
* User activity review
* Application performance check
* Identify optimization opportunities
**Monthly**
* Trend analysis over time
* Calculate success metrics
* Review ROI of integrations
* Plan improvements or additions
### Combining with Other Features
**Dashboard + Actions**
1. See error spike in Dashboard
2. Navigate to Actions
3. Filter by error codes
4. Identify and fix root cause
**Dashboard + Audit Logs**
1. Notice usage change
2. Check Audit Logs for changes
3. Correlate configuration updates
4. Adjust as needed
**Dashboard + Settings**
1. Identify slow applications
2. Review application settings
3. Optimize configurations
4. Monitor improvement
### Setting Goals
**Usage Goals**
* Target daily action count
* Desired user adoption rate
* Application coverage percentage
* Success rate threshold (e.g., >95%)
**Performance Goals**
* Average response time targets
* Cache hit rate goals
* Error rate limits
* User satisfaction scores
## Exporting Data
### Use Cases for Export
* External reporting tools
* Executive presentations
* Long-term trend analysis
* Integration with other systems
### Export Options
* Download as CSV or JSON
* Include selected date range
* Filter before export
* Schedule regular exports (if available)
## Troubleshooting
### Dashboard Shows No Data
**Possible Causes**
* Date range has no activity
* Filters excluding all data
* No actions executed yet
* Loading in progress
**Solutions**
1. Expand date range
2. Clear any filters
3. Execute actions in Copilot
4. Refresh the page
5. Wait for data to load
### Charts Not Loading
**Possible Causes**
* Network connectivity issues
* Browser compatibility
* Large dataset timeout
* JavaScript errors
**Solutions**
1. Check internet connection
2. Try different browser
3. Reduce date range
4. Clear browser cache
5. Contact support if persists
### Unexpected Data
**Possible Causes**
* Timezone differences
* Test or automated actions included
* Multiple users sharing account
* Cached data not refreshed
**Solutions**
1. Verify timezone settings
2. Filter by specific users
3. Check for automated workflows
4. Refresh dashboard
5. Verify date range selection
## Privacy and Security
### Data Displayed
* Aggregated usage metrics
* User activity summaries
* Application statistics
* Performance metrics
### Data Not Shown
* Sensitive API data
* Authentication credentials
* Personal information
* Raw request/response bodies
### Access Control
* Role-based access
* Organization-level visibility
* User privacy respected
* Audit trail of dashboard access
## Mobile Access
The Dashboard is optimized for mobile viewing:
* Responsive charts
* Touch-friendly controls
* Swipe navigation
* Essential metrics prioritized
## Next Steps
* [Review specific actions](/user-guide/actions) for detailed debugging
* [Open Insights](/user-guide/insights) for per-agent performance analytics
* [Configure applications](/user-guide/applications) to improve success rates
* [Create agents](/user-guide/agents) for common workflows
* [Check audit logs](/user-guide/audit) for configuration changes